Overview
Canvas elements render as pixels on the screen that do not scale like SVG. JavaScript is used to dynamically draw on the canvas at runtime which allows creation of dynamic images like charts and graphs. Canvas is often used for HTML5 desktop and mobile game development.
The canvas element has support in all browsers and will render on screen but the canvas content will not be accessible to screen readers. With canvas the accessibility has to be added with JavaScript or ARIA on the canvas element itself or using internal fallback content placed within the opening and closing canvas tag. Canvas content is not part of the DOM except for the fallback content.
SVG is a better choice for interactive content and custom controls than Canvas because SVG has internal accessibility semantics and ability to easily add interactivity with JavaScript.
Canvas should not be used to generate text because it renders as an image of text that pixellates when enlarged and cannot be customized by the user like CSS text.
Canvas element must have an accessible name and description that matches the visible text and content inside the canvas drawing area.
Canvas elements that are used as mouse and keyboard operable custom UI controls must have an accessibility role, i.e. role=button for custom canvas buttons.
Canvas References:
Canvas elements MUST have a text alternative
The canvas element that renders on screen is not accessible to screen readers because the content is not in the DOM and has no accessibility semantics. Either internal fallback content or ARIA semantics must be used to create an text alternative accessible to screen readers.
ARIA as alt text
Using ARIA role=img and aria-label="alt text" on the <canvas> element or the internal fallback content creates an element available to the screen reader via Image quick navigation commands with the image role spoken based on role=img.
Fallback content as alt text
Internal fallback content between the opening and closing canvas tags, e.g. <canvas height=200 width=400>Fallback Content Static Text</canvas>, does not have an image role unless ARIA is applied and the focusable area is not the full canvas rectangle, the touch target area and screen reader focus outline only surrounds fallback content text. By placing role=img and an aria-label value directly on the <canvas> tag the touch target and screen reader focus area correctly surrounds the enter canvas element.
If fallback content is used then it must also be accessible and not simply tell the user that their browser does not support canvas.
Good example: Canvas element with accessible name and role via ARIA
<canvas id="goodCanvas1" width="400" height="100" aria-label="Hello ARIA World" role="img"></canvas>
<script>
var canvas = document.getElementById("goodCanvas1");
var ctx = canvas.getContext("2d");
ctx.font= "30px Comic Sans MS";
ctx.fillStyle = "green";
ctx.fillRect(0,0,400,100);
ctx.fillStyle = "white";
ctx.textAlign = "center";
ctx.fillText("Hello ARIA World", canvas.width/2, canvas.height/2);
</script>
OK example: Canvas element with text alternative via fallback content
<canvas id="okCanvas2" width="400" height="100"><p>Hello Fallback World</p></canvas>
<script>
var canvas = document.getElementById("okCanvas2");
var ctx = canvas.getContext("2d");
ctx.font= "30px Comic Sans MS";
ctx.fillStyle = "darkgreen";
ctx.textAlign = "center";
ctx.fillText("Hello Fallback World", canvas.width/2, canvas.height/2);
</script>
Bad example: Canvas element without accessible name or role
<canvas id="badCanvas1" width="400" height="100"></canvas>
<script>
var canvas = document.getElementById("badCanvas1");
var ctx = canvas.getContext("2d");
ctx.font= "30px Comic Sans MS";
ctx.fillStyle = "red";
ctx.textAlign = "center";
ctx.fillText("Hello Inaccessible World", canvas.width/2, canvas.height/2);
</script>
Bad example: Canvas element with inaccessible fallback content
<canvas id="badCanvas2" width="400" height="100">Your browser does not support the canvas element.</canvas>
<script>
var canvas = document.getElementById("badCanvas2");
var ctx = canvas.getContext("2d");
ctx.font= "30px Comic Sans MS";
ctx.fillStyle = "darkred";
ctx.textAlign = "center";
ctx.fillText("Hello Inaccessible World", canvas.width/2, canvas.height/2);
</script>
Canvas elements used as complex images MUST have a text alternative
The canvas element used in the demo is from the Safari HTML5 Canvas Guide.
Fallback content as alt text
If you place a data table inside the canvas tag as fallback content the screen reader user will hear it all as a single string of text and will not be able to navigate the cells and hear row and column headers spoken or a table caption. The fallback text can direct the user to the data table below as the text alternative for the canvas graphic.
Good example: Canvas element with accessible name and role via ARIA
Neurons in Cerebral Cortex
  <div align="center">
    <h2>Neurons in Cerebral Cortex</h2>
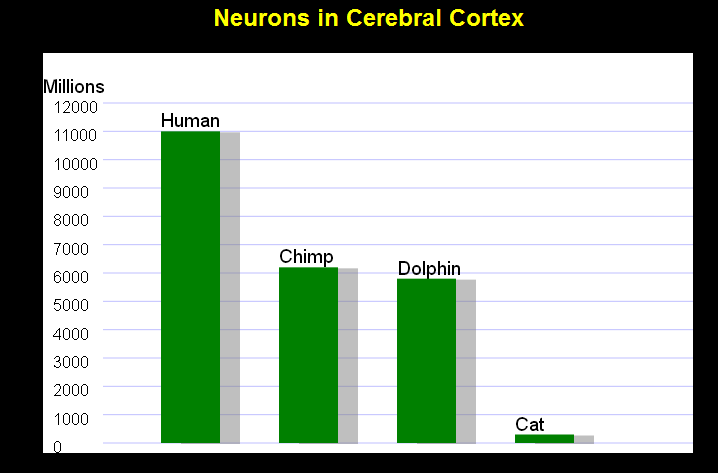
    <canvas id="can" height="400" width="650" role="img" aria-label="Bar Chart Values in Millions from 0 to 12000. Human: 11000, Chimp: 6200, Dolphin: 5800, Cat: 300"> </canvas>
  </div>
  <script type="text/javascript">
        var can, ctx,
            minVal, maxVal,
            xScalar, yScalar,
            numSamples, y;
        // data sets -- set literally or obtain from an ajax call
        var dataName = [ "Human", "Chimp", "Dolphin", "Cat" ];
        var dataValue = [ 11000, 6200, 5800, 300 ];

            // set these values for your data
            numSamples = 4;
            maxVal = 12000;
            var stepSize = 1000;
            var colHead = 50;
            var rowHead = 60;
            var margin = 10;
            var header = "Millions"
            can = document.getElementById("can");
            ctx = can.getContext("2d");
            ctx.fillStyle = "white"
			ctx.fillRect(0,0,650,400);
            ctx.fillStyle = "black"
            yScalar = (can.height - colHead - margin) / (maxVal);
            xScalar = (can.width - rowHead) / (numSamples + 1);
            ctx.strokeStyle = "rgba(128,128,255, 0.5)"; // light blue line
            ctx.beginPath();
            // print  column header
            ctx.font = "14pt Helvetica"
            ctx.fillText(header, 0, colHead - margin);
            // print row header and draw horizontal grid lines
            ctx.font = "12pt Helvetica"
            var count =  0;
            for (scale = maxVal; scale >= 0; scale -= stepSize) {
                y = colHead + (yScalar * count * stepSize);
                ctx.fillText(scale, margin,y + margin);
                ctx.moveTo(rowHead, y)
                ctx.lineTo(can.width, y)
                count++;
            }
            ctx.stroke();
            // label samples
            ctx.font = "14pt Helvetica";
            ctx.textBaseline = "bottom";
            for (i = 0; i < 4; i++) {
                calcY(dataValue[i]);
                ctx.fillText(dataName[i], xScalar * (i + 1), y - margin);
            }
            // set a color and a shadow
            ctx.fillStyle = "green";
            ctx.shadowColor = 'rgba(128,128,128, 0.5)';
            ctx.shadowOffsetX = 20;
            ctx.shadowOffsetY = 1;
            // translate to bottom of graph and scale x,y to match data
            ctx.translate(0, can.height - margin);
            ctx.scale(xScalar, -1 * yScalar);
            // draw bars
            for (i = 0; i < 4; i++) {
                ctx.fillRect(i + 1, 0, 0.5, dataValue[i]);
            }

        function calcY(value) {
            y = can.height - value * yScalar;
        }
    </script>
Good example: Canvas element with text alternative via data table
Neurons in Cerebral Cortex
Neurons in Cerebral Cortex
| Value |
Human |
Chimp |
Dolphin |
Cat |
| Millions |
11000 |
6200 |
5800 |
300 |
    <canvas id="can2" height="400" width="650">Text alternative for this canvas graphic is in the data table below.</canvas>
    <table border="0" cellpadding="5" summary="This is the text alternative for the canvas graphic.">
      <caption>
      Neurons in Cerebral Cortex
      </caption>
      <tbody>
        <tr>
          <th scope="col">Value</th>
          <th scope="col">Human</th>
          <th scope="col">Chimp</th>
          <th scope="col">Dolphin</th>
          <th scope="col">Cat</th>
        </tr>
        <tr>
          <th scope="row">Millions</th>
          <td>11000</td>
          <td>6200</td>
          <td>5800</td>
          <td>300</td>
        </tr>
      </tbody>
    </table>
Bad example: Canvas element without accessible name or role
Neurons in Cerebral Cortex
  <div align="center">
    <h2>Neurons in Cerebral Cortex</h2>
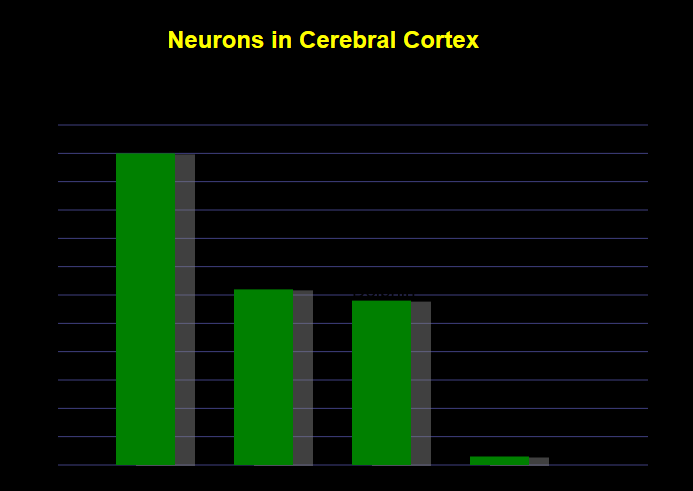
    <canvas id="can3" height="400" width="650" > </canvas>
  </div>
  <script type="text/javascript">
        var can, ctx,
            minVal, maxVal,
            xScalar, yScalar,
            numSamples, y;
        // data sets -- set literally or obtain from an ajax call
        var dataName = [ "Human", "Chimp", "Dolphin", "Cat" ];
        var dataValue = [ 11000, 6200, 5800, 300 ];

            // set these values for your data
            numSamples = 4;
            maxVal = 12000;
            var stepSize = 1000;
            var colHead = 50;
            var rowHead = 60;
            var margin = 10;
            var header = "Millions"
            can = document.getElementById("can3");
            ctx = can.getContext("2d");
            ctx.fillStyle = "black"
            yScalar = (can.height - colHead - margin) / (maxVal);
            xScalar = (can.width - rowHead) / (numSamples + 1);
            ctx.strokeStyle = "rgba(128,128,255, 0.5)"; // light blue line
            ctx.beginPath();
            // print  column header
            ctx.font = "14pt Helvetica"
            ctx.fillText(header, 0, colHead - margin);
            // print row header and draw horizontal grid lines
            ctx.font = "12pt Helvetica"
            var count =  0;
            for (scale = maxVal; scale >= 0; scale -= stepSize) {
                y = colHead + (yScalar * count * stepSize);
                ctx.fillText(scale, margin,y + margin);
                ctx.moveTo(rowHead, y)
                ctx.lineTo(can.width, y)
                count++;
            }
            ctx.stroke();
            // label samples
            ctx.font = "14pt Helvetica";
            ctx.textBaseline = "bottom";
            for (i = 0; i < 4; i++) {
                calcY(dataValue[i]);
                ctx.fillText(dataName[i], xScalar * (i + 1), y - margin);
            }
            // set a color and a shadow
            ctx.fillStyle = "green";
            ctx.shadowColor = 'rgba(128,128,128, 0.5)';
            ctx.shadowOffsetX = 20;
            ctx.shadowOffsetY = 1;
            // translate to bottom of graph and scale x,y to match data
            ctx.translate(0, can.height - margin);
            ctx.scale(xScalar, -1 * yScalar);
            // draw bars
            for (i = 0; i < 4; i++) {
                ctx.fillRect(i + 1, 0, 0.5, dataValue[i]);
            }

        function calcY(value) {
            y = can.height - value * yScalar;
        }
    </script>
Overview
Custom UI controls can be created as canvas elements with JavaScript event handling. Canvas elements that are operable with the mouse must also work with the keyboard. Hover styles should match keyboard focus styles. Canvas controls with onclick and onmousedown events must have keyboard events that check for enter and spacebar key activation.
Accessible Name and Role
Standard ARIA methods to provide custom controls accessible names and roles works the same for canvas elements. E.g. <canvas role=button aria-label="Accessible Name"></canvas> speaks as "Accessible Name button".
Fallback content can also be used by placing a native button the canvas tag and attaching the mouse behavior of the canvas button as keyboard events of the native button. This allows keyboard users to tab to the button and it will have a native role and text value. Keyboard focus outline will not surround the canvas if fallback content is used so a focus indicator would have to added.
Canvas elements operable with mouse MUST also be keyboard accessible
Keyboard Focusability
Use tabindex=0 to make a canvas element focusable in the default source code order when tabbing. Tabindex only make the element TABable, but it will not activate with enter or spacebar keys until the extra events are added.
Keyboard Operability
Canvas elements have no native keyboard operability so onclick events will not be triggered by enter or spacebar keys. Add an onkeydown event that checks if the enter or spacebar keyCode keys are pressed, then prevents the default behavior and fires the normal button code that was previously only mouse operable.
Good example: Canvas buttons with focusability and accessible JavaScript keyboard events
<canvas id="mycanvas" width="128" height="36" tabindex="0" role="button" aria-label="Canvas button"
onkeydown="if(event.keyCode==13 || event.keyCode==32){event.preventDefault(); canvasDown(this)}"
onkeyup="if(event.keyCode==13 || event.keyCode==32){event.preventDefault(); canvasUp(this)}"
 onmousedown="canvasDown(this)"  onmouseup="canvasUp(this)"
 onmouseover="canvasOver()" onmouseout="canvasOut()"
 onfocus="canvasOver()" onblur="canvasOut()"> </canvas>
<canvas tabindex="0" role="button" aria-label="Home" onmouseover="drawCanvas2()" onmouseout="drawCanvas1()" onfocus="drawCanvas2()" onclick="document.getElementById('canvasStorage').innerHTML='Clicked on Home button'" onkeydown="if(event.keyCode==13){event.preventDefault();document.getElementById('canvasStorage').innerHTML='Pressed Enter on Home button'}; if(event.keyCode==32){event.preventDefault();document.getElementById('canvasStorage').innerHTML='Pressed Spacebar on Home button'}" onblur="drawCanvas1()" width="100" height="50" id="gradientCanvas"> Your browser does not support HTML5 Canvas. </canvas>
Bad example: Canvas button with no keyboard accessibility or name and role
<canvas id="mycanvas2" width="128" height="36"
 onmousedown="canvasDown2(this)"  onmouseup="canvasUp2(this)"
 onmouseover="canvasOver2()" onmouseout="canvasOut2()"> </canvas>

