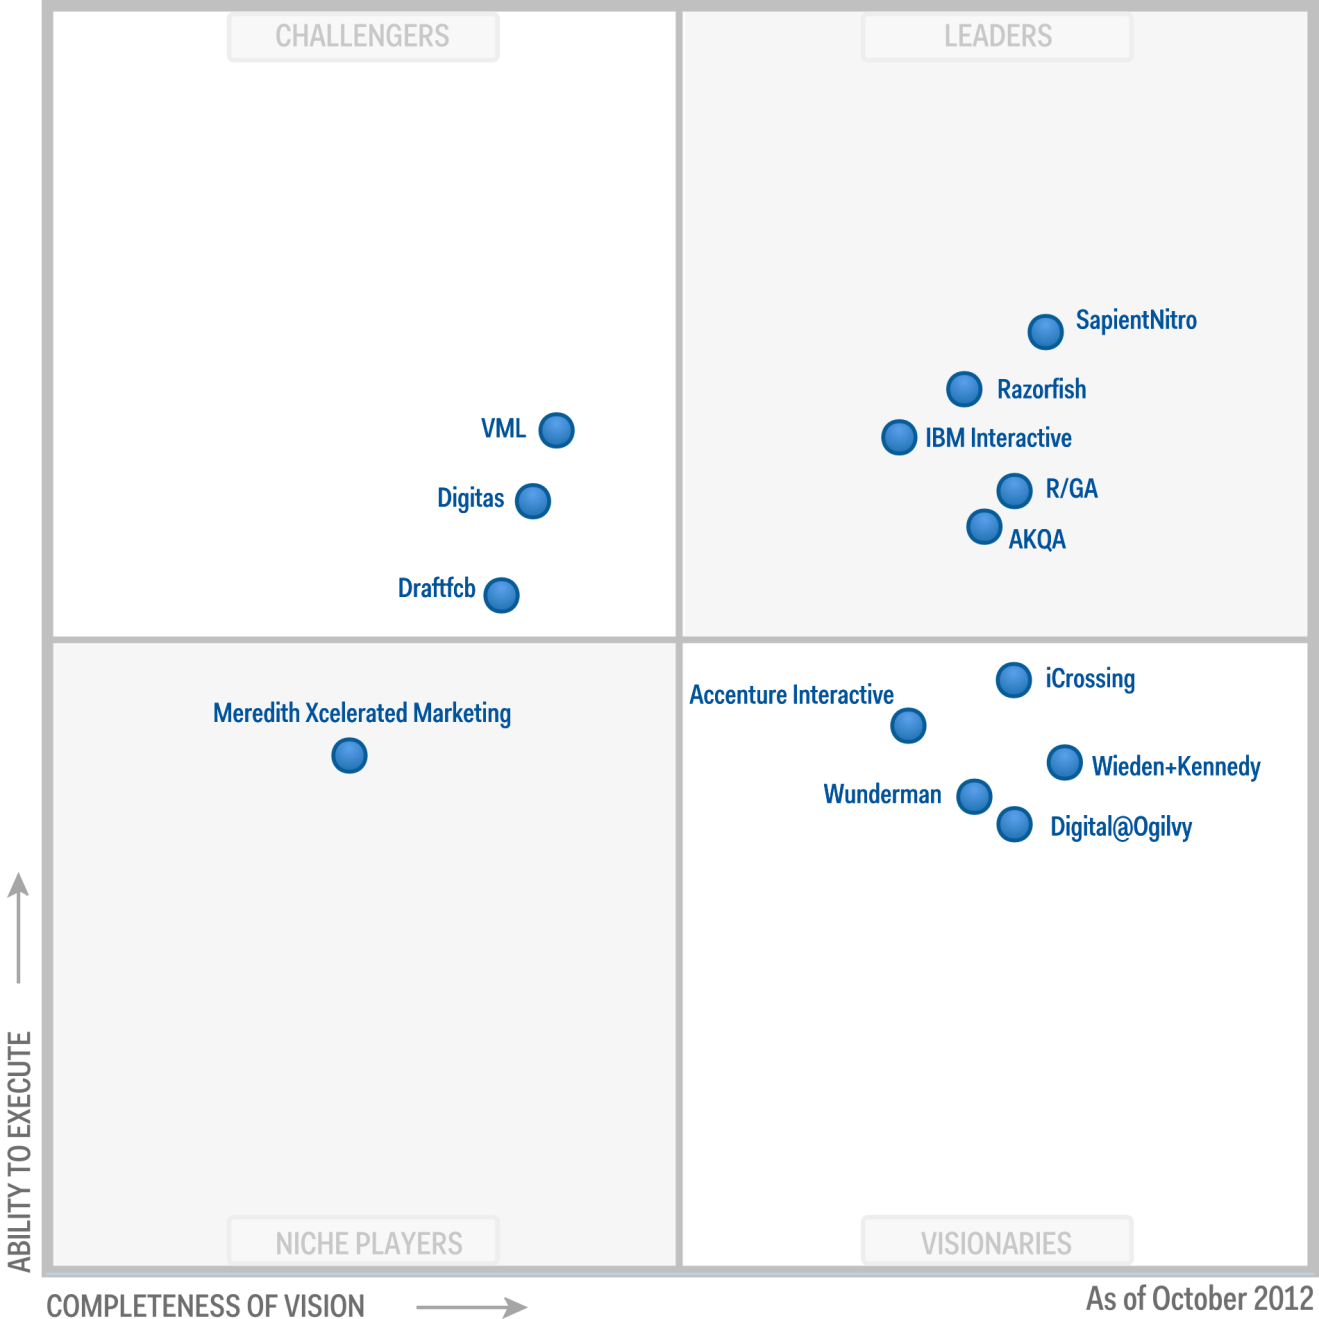
Figure 1. Magic Quadrant for Global Digital Marketing Agencies

| Measurement | Challengers | Leaders | Niche Players | Visionaries |
|---|---|---|---|---|
| Ability to Execute |
|
|
|
|
| Completeness of Vision |
|
|
|
|

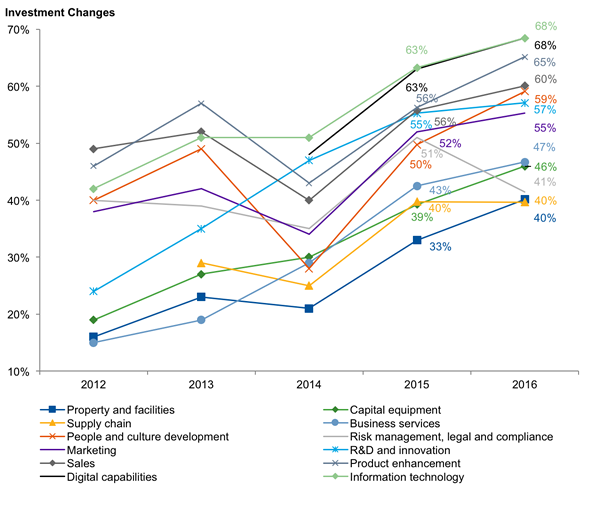
| Category | 2012 | 2013 | 2014 | 2015 | 2016 |
|---|---|---|---|---|---|
| Property and facilities | 16% | 23% | 21% | 33% | 40% |
| Supply chain | 29% | 25% | 40% | 40% | |
| Capital equipment | 19% | 27% | 30% | 39% | 46% |
| Risk management, legal and compliance | 40% | 39% | 35% | 51% | 41% |
| Business services | 15% | 19% | 29% | 43% | 47% |
| Marketing | 38% | 42% | 34% | 52% | 55% |
| R&D and innovation | 24% | 35% | 47% | 55% | 57% |
| People and culture development | 40% | 49% | 28% | 50% | 59% |
| Sales | 49% | 52% | 40% | 56% | 60% |
| Product enhancement | 46% | 57% | 43% | 56% | 65% |
| Digital capabilities | 48% | 63% | 68% | ||
| Information technology | 42% | 51% | 51% | 63% | 68% |

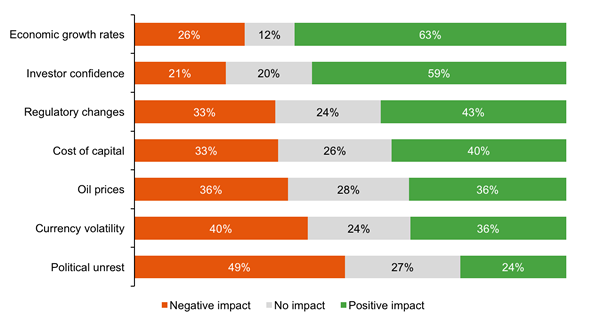
| Category | Negative impact | No impact | Positive impact |
|---|---|---|---|
| Political unrest | 49% | 27% | 24% |
| Currency volatility | 40% | 24% | 36% |
| Oil prices | 36% | 28% | 36% |
| Cost of capital | 33% | 26% | 40% |
| Regulatory changes | 33% | 24% | 43% |
| Investor confidence | 21% | 20% | 59% |
| Economic growth rates | 26% | 12% | 63% |
